Here are the results of a survey that we launched on the 8th March to gauge some high-level voter feelings as we began our election coverage of the 2019 Stone Town Council and Stafford Borough Council elections.
Over ten days, we received 531 completed responses to the survey although 797 people started the survey.
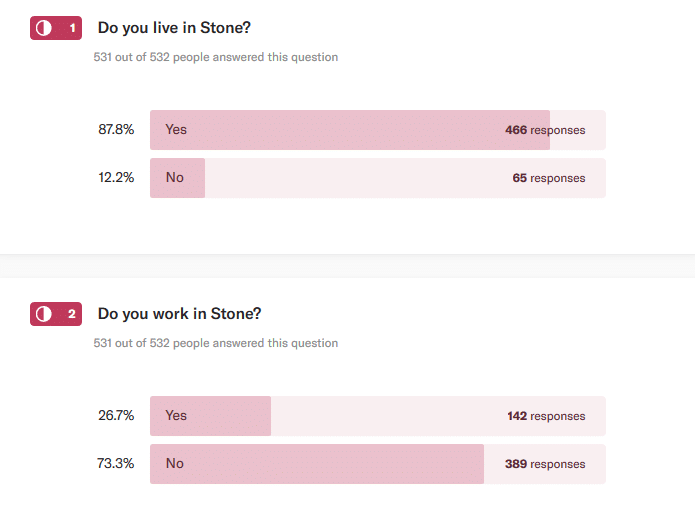
Of the respondents, 87.8% (466) lived in Stone with 26.7% (142) working in Stone.
 [divider style=”solid” top=”20″ bottom=”20″]
Of the survey respondents, 97.7% were currently registered to vote; however only 90.6% said they would be voting in the upcoming elections.

If you’re not registered to vote then head on over to here for details on how to register.
[divider style=”solid” top=”20″ bottom=”20″]
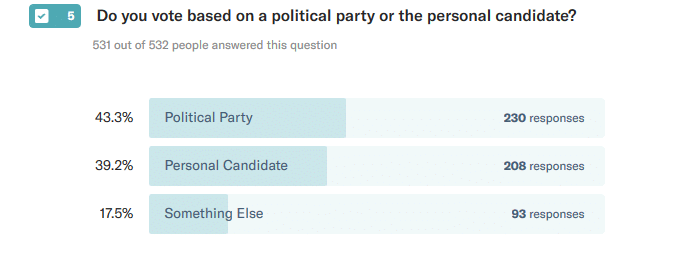
When asked whether they voted for a political party or personal candidate, political party came out ahead with, 43.4%, 39.2%.chose Personal Candidate and 17.5% vote based on something else (which may obviously take either of the previous 2 into consideration).
 [divider style=”solid” top=”20″ bottom=”20″]
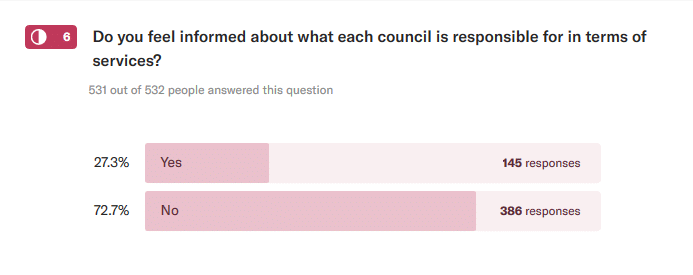
By a large margin, respondents felt that they didn’t know enough about what each of the councils was responsible for.
 To help address this, you can refer to our initial introduction piece – 2019 Elections or check out the video below that we created:

[divider style=”solid” top=”20″ bottom=”20″]
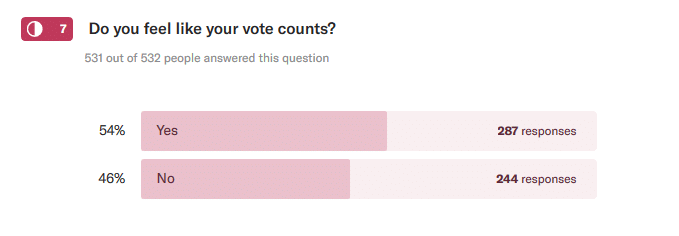
A crucial question is whether voters think that their vote matters. This was a very close call and may be more representative of the feeling following the recent Brexit referendum and general elections. With local elections there should be much more direct impact from your vote as you’re voting for people to make changes on the ground that really affect you.
[divider style=”solid” top=”20″ bottom=”20″]
 Question 8 on the survey asked for feedback on what our coverage should include.
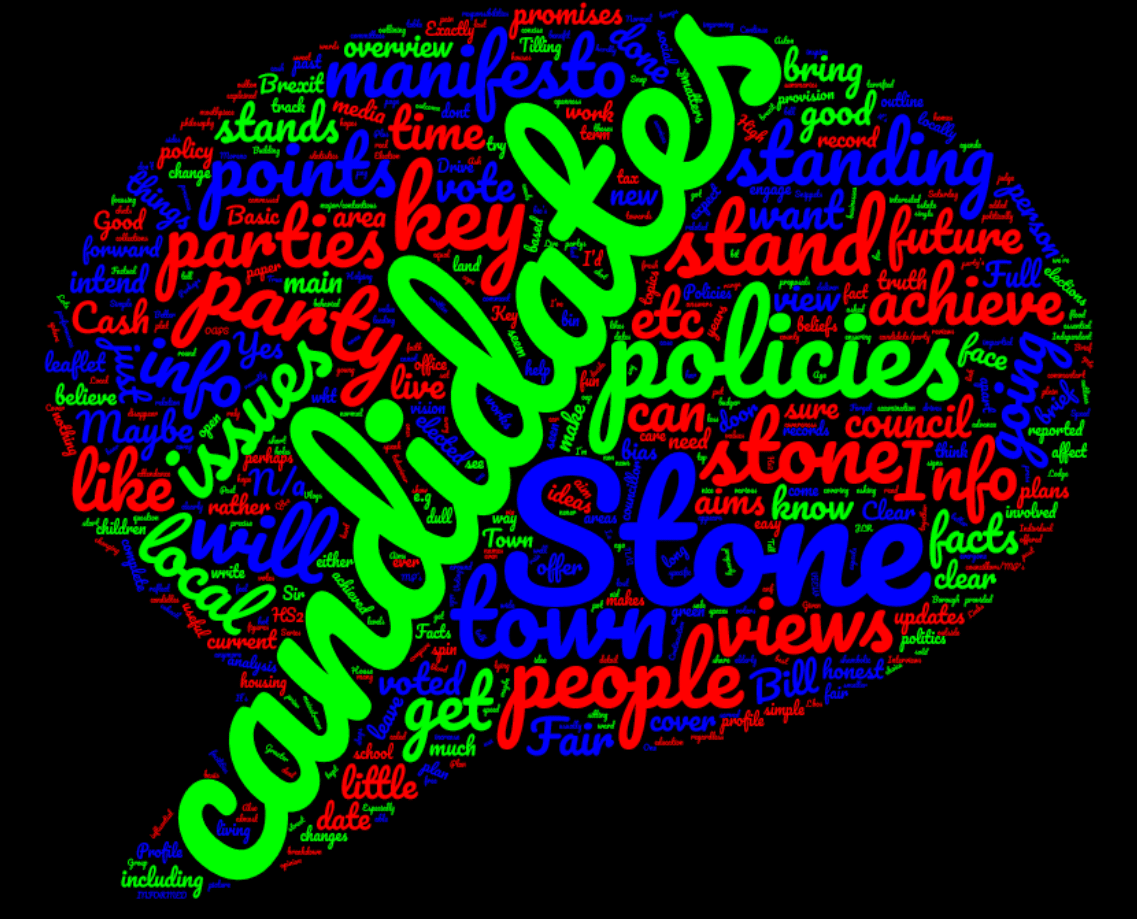
This was a free format, optional question and the key takeaway points were:
- Candidate Profiles
- Manifesto / What they are standing for
- Transparency
- Honesty
- Unbiased
The image is a word cloud from all the answers, the larger the word the more frequently it was mentioned.
[divider style=”solid” top=”20″ bottom=”20″]
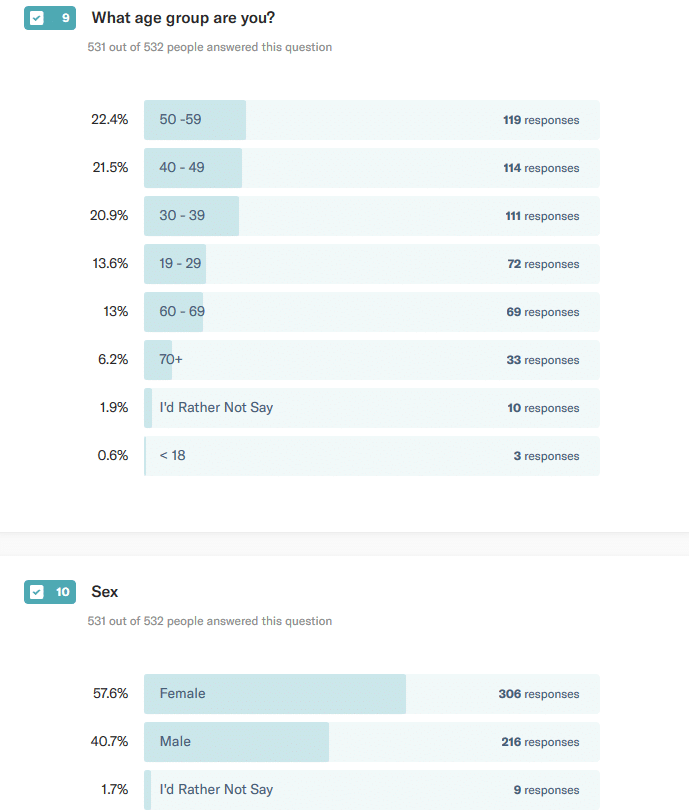
The final two questions related to understanding the profile of the respondents in terms of age range and sex.
[divider style=”solid” top=”20″ bottom=”20″]
You can keep up to date with our latest election coverage by checking this page – 2019 Stone Elections